Enterprise Linux — iSCSI / Multipath / Pacemaker / Corosync
Introduction
Most of the attention in modern infrastructure goes to cloud-native, horizontally-scalable systems. But a large share of the software that keeps real businesses running can’t work that way — whether due to data consistency constraints, licensing, or simply because the application was built assuming it’s the only instance.
For those workloads, the redundancy model is active/standby: one live instance, one warm spare. That’s the class of problem this guide addresses.
Pacemaker is the de facto standard for application-level HA clustering on Linux. Development began in 2004 as a collaborative effort through the ClusterLabs community, with sustained backing from Red Hat and SUSE. It ships with most modern Linux distributions and has been deployed in critical environments worldwide.
Other tools exist in adjacent space on Linux — Keepalived being a popular option, particularly for simpler failover scenarios — but Pacemaker/Corosync is what HA clustering on Linux means in the enterprise.
What follows is a complete, end-to-end implementation walkthrough:
- iSCSI multipath — shared storage accessible from multiple hosts
- LVM with exclusive activation — ensuring only one host mounts the volume at a time
- Pacemaker/Corosync — the cluster manager that orchestrates failover
- PostgreSQL + a floating VIP — the workload being protected, reachable at a stable address
The configuration is validated against four distinct failure scenarios.
Want to jump ahead? Go to the HA Cluster Lab Build section.
The Traditional UNIX Service Model
While it is often assumed that early UNIX lacked a meaningful supervision model, the architecture for it was present remarkably early. The init process itself predates System III, where it already handled spawning and re-spawning login processes. However, in UNIX System III it was formalized into a table-driven model with the introduction of /etc/inittab and explicit actions such as respawn, a design later refined in UNIX System V (1983). This established what became known as the “SysV init” standard that would dominate the UNIX landscape for decades.
In the serial-terminal era, init functioned primarily as a lifecycle manager for getty processes. Because a getty was designed to exit upon a user’s logout, init’s respawn action served as the essential mechanism to cycle the terminal back to a fresh login prompt. However, as systems evolved toward networked workstations, they required a boot sequence capable of handling complex, one-time dependencies—logic for which the inittab was never intended. Rather than attempting a structural redesign of the init daemon, implementers in both the System V and BSD camps evolved towards a similar pragmatic pattern: using init primarily as a bootstrap to launch flexible subordinate shell scripts, while leaving only the simplest always-on processes—principally getty—to be directly supervised. In practice, init became a runlevel transition orchestrator more than a general service supervisor.
While inittab remained the system’s entry point, service startup for a run level was effectively funneled through a small number of entries that invoked master startup scripts. These scripts then executed individual service scripts in sequence.
Because shell scripts execute sequentially, any service they launch must return control to the calling script; otherwise, the boot sequence would stall. In practice, this required services to place themselves into the background before continuing.
Several mechanisms could achieve this—ranging from simple shell backgrounding to more structured approaches—but a standard pattern emerged: daemonization. This involved a deliberate sequence of forks to detach the process from the controlling terminal, re-parent it to PID 1, and allow the invoking script to proceed.
While not the only possible approach, daemonization became the dominant convention, providing a consistent and robust way to satisfy the constraints imposed by the rc-driven boot model.
The table-driven model that could have provided structured lifecycle management—where services could be individually named, tracked, and assigned respawn semantics—remained in place, but was no longer populated with those services.
Instead, responsibility for service startup was pushed outward into shell scripts, and with it, responsibility for ongoing supervision effectively disappeared.
Without effective supervision, if a service terminated abnormally, it simply vanished.
Why It Worked for So Long
For most of UNIX history, this was a reasonable tradeoff. The people writing UNIX daemons were largely Bell Labs researchers, BSD contributors at Berkeley, and the early Internet RFC implementors — often the same people who invented the protocols they were implementing. Vixie maintained and led BIND (named) and wrote cron. Allman wrote sendmail. The software wasn’t flawless — BIND had rough eras, sendmail had rough eras — but these were not average practitioners, and their code was deployed worldwide and scrutinized accordingly. By the time a mid-90s sysadmin was running them in production, the things had been battle-tested in a way most business software never gets to be. The combination of authorship quality, deployment scale, feedback loop tightness, and evolution discipline — sustained over decades — made the assumption a service would remain running indefinitely usually correct in practice. This was UNIX and, later, Linux as academic and hobbyist systems — run by people who studied computing for its own sake, on a small canon of daemons written by the same community that defined the protocols.
It also made the workaround invisible as a workaround. Daemonization had originated as a kludge — a way to slip past inittab’s limitations by handing processes off through a sequence of forks — but decades of it simply working, in the hands of people who knew what they were doing, erased that origin. Engineers inheriting the arrangement encountered daemonization as the paradigm, not as the accommodation it had been. You didn’t choose to write a daemon that double-forks; that was simply what writing a daemon meant. The alternative had become difficult even to imagine.
The Commercial Debut of Linux
In the early 2000s, Linux was adopted commercially at scale for the first time — by a new generation of Internet-era businesses that had never run commercial UNIX, and by software and appliance vendors shipping into markets that commercial UNIX never served. The software running on Linux changed accordingly. Business application stacks were built by a much larger, more heterogeneous group, writing under deadline pressure for niche markets rather than global infrastructure. The results were different:
- Slow memory leaks triggering the OOM killer.
- Latent bugs causing segfaults on rare or malformed input.
- Unclean shutdowns leaving stale pidfiles that made the system think a service was still running when it wasn’t.
- A subtler class of failure left the process running but non-functional, for example due to exhausted connection pools or deadlocked threads.
Discovery of a failed service was usually slow — a user complained or someone noticed by chance. The gap between failure and awareness was often measured in hours or days.
The First Real Challenge
It wasn’t until the late 1990s that this paradigm was explicitly challenged as a structural flaw. In 1998, Daniel J. Bernstein (djb) released daemontools, a suite that aimed to restore the supervision model by forcing services to run in the foreground. Bernstein famously argued that ‘self-daemonization’—the very double-forking trick that made rc scripts possible—was actually a bug. To him, the fact that a service detached itself from its parent was a loss of control, an act of ‘process-management malpractice’ that made it impossible for the system to know if its critical tasks were alive or dead.
Within the open-source and academic world, this was a minority view. Most practitioners encountered it, if at all, as the opinion of a famously particular person — correct, perhaps, but not urgent. A small subset of teams who actually needed to run things reliably, particularly dot-com-era operations shops, adopted daemontools or its successor runit quietly and without fanfare. For the rest, the rc script model persisted.
Want to jump ahead? Go to the HA Cluster Lab Build section.
The Other World
For roughly two decades — from the mid-1980s through the early 2000s — commercial UNIX was not a niche. Sun, IBM, HP, and SGI all addressed the market. Sun alone grew from $1 billion in revenue in 1988 to over $15 billion by 2000. IBM and HP each ran UNIX server businesses in the multi-billion dollar range through the same period. The overall UNIX server market was valued at roughly $17.5 billion as late as 2005 — by which point it was already in decline. At its peak in the late 1990s it was larger.
The engineering investment that went into those platforms — including the systems software — was funded accordingly.
The result was that hard infrastructure problems got solved on commercial UNIX first, on a timetable roughly a decade ahead of Linux, because the companies building these platforms had both the resources and the direct incentive to solve them. Application clustering — IBM HACMP, HP Serviceguard, Veritas Cluster Server — was a shipping, production-hardened product category on commercial UNIX through the mid-1990s, while Linux was still figuring out basic reliability. Journaling filesystems arrived on AIX, IRIX, and Veritas’s VxFS in the early 1990s; Linux wouldn’t have a production journaling filesystem until ext3 in 2001. Online filesystem resizing, logical volume management, dynamic tracing, NUMA awareness, and service supervision followed the same pattern: solved on AIX or HP-UX or Solaris first, absorbed into Linux years or in some cases over a decade later.
IBM had quietly addressed the service supervision problem on AIX in 1990 — eight years before djb published daemontools, and twenty years before systemd. AIX 3 shipped the System Resource Controller, which introduced a srcmstr daemon that maintained direct parent-child relationships with managed services. If a controlled process died, srcmstr detected the exit immediately, re-spawned it, and logged the event to the system error log. This is structurally the same insight Bernstein would later make famous in the open-source world. SRC also introduced grouping and a uniform management interface — startsrc, stopsrc, lssrc — that replaced ad-hoc rc script invocations.
The most complete pre-systemd answer came from Sun. Solaris 10, released in 2005, shipped the Service Management Facility — a ground-up redesign that replaced init scripts entirely and treated services as first-class objects with declared dependencies, defined states, and automatic restart on failure. SMF’s svc.startd maintained direct supervision of managed processes; services were expected to run in the foreground under its watch, and if a process exited unexpectedly, the framework restarted it automatically, honoring dependency order. Crucially, SMF integrated with Solaris’s Fault Manager to distinguish between transient crashes and persistent failures, applying configurable backoff rather than looping blindly. The management interface — svcs, svcadm, svccfg — provided the kind of uniform, queryable service model that Linux lacked entirely. SMF predated systemd by roughly six years.
Incomplete Fixes
In many areas, commercial UNIX innovations did make their way into Linux. But in service supervision and lifecycle management, they largely did not. SRC was an AIX feature; SMF shipped on Solaris the year before Sun’s commercial decline became terminal. Both were gated behind vendor licenses and hardware, and neither was ported. Linux inherited the rc-script model from its academic lineage and nothing from the commercial lineage that had already solved the problem. The open-source industry improvised three incomplete strategies:
- External Monitoring: Systems like Nagios provided visibility but were purely reactive, alerting humans after a service had died.
- Local Watchdogs: Tools like Monit attempted active recovery from the “side,” but remained bolt-on additions that required manual coordination with the existing init scripts.
- Alternative Supervisors: A small subset of visionary teams adopted purpose-built supervisors like
daemontoolsorrunit. These shifted the paradigm by running services in the foreground to maintain a direct parent-child link for instant restarts.
The third category deserves more precision than “visionary.” Bernstein’s daemontools release in 1998 was partly evangelism — he was making an argument about what was wrong with the prevailing model, loudly and in his characteristic style. But the argument was also right on time. Shops running serious production workloads in that era — high-volume mail infrastructure was the canonical case, but any operation that needed a specific service to actually stay up — adopted daemontools or runit not primarily because they’d been converted to a philosophy, but because they needed something that worked and this was it.
The result was a hybrid. These tools were adopted strategically — deployed around the specific workload that needed real supervision — while the rest of the system stayed on rc scripts.
The Modern Pivot: 2011–2015
Between roughly 2011 and 2015, the enterprise Linux world transitioned away from sequential shell scripts and toward declarative service management. Ubuntu’s Upstart took an earlier run at this, but systemd emerged as the definitive standard — shipping as the default in RHEL 7 and across the major distributions shortly after. For the first time since inittab had been hollowed out, services were individually named, tracked, and given lifecycle policy in a central place. A process that exited could be caught and restarted automatically, with configurable backoff. The supervision capability was back.
Three things about systemd’s model are worth being exact about.
-
Restart is opt-in. On a current enterprise Linux distribution, if you kill a running service — chronyd, say — it stays dead. Someone has to have written
Restart=on-failureor similar into the unit file for supervision to apply. The mechanism exists again, but whether any given service is entered into it with meaningful lifecycle policy is still a per-service decision made by whoever packaged it. -
The watchdog is shallower than it looks. Restart on process exit is a solved problem: the kernel reports the exit, Restart=on-failure acts on it, and the service comes back. Restart on watchdog timeout is an opportunistic extension — if the service emits heartbeats via sd_notify and stops, systemd restarts it. The heartbeat is structurally a liveness signal only, not a health check. A daemon that knew it was internally unhealthy would typically try to recover in-process or exit deliberately, not go silent.
-
There is no hook for protocol-aware health checks. systemd provides no plugin interface where a probe for a given protocol is implemented once by people who understand that protocol, and the deployment supplies the specifics: endpoint, credentials, expected response. Whether to use it would be the operator’s call, and package maintainers could ship sensible baselines that most deployments would never need to touch. In this respect systemd lags its container-world analog: Kubernetes’ kubelet has shipped first-class health probes driving restart since early in its life.
A service with a configured watchdog looks more supervised than it is. The watchdog catches one thing well — a stalled main loop — because that failure is cheap to detect with the signaling primitive that was easy to add. Everything else the service might do wrong remains invisible to systemd. Some of that goes unnoticed by the practitioners running these systems. Where practitioners have noticed that gap, the instinct has been to reach for external monitoring — and that instinct is worth examining.
Want to jump ahead? Go to the HA Cluster Lab Build section.
The Monitoring Objection
The prevailing response to systemd’s health-checking gap is that external monitoring exists for exactly this purpose. It is a reasonable instinct — and like a lot of reasonable instincts, it has hardened into convention before anyone fully examined what it forecloses.
External monitoring provides visibility; it does not remediate by default. The output is an alert, not a fix. Visibility and remediation are complementary, not alternatives — the correct answer is often both, with local action as the first response and alerting as awareness and fallback.
Driving remediation from an external monitoring posture is possible but structurally second-class. Monitoring systems rely on polling intervals and confirmation thresholds, ensuring that any triggered action works against a stale view of the service. Because recovery is delicate, it benefits substantially from the synchronous, direct access only available to local supervisors. An external fix operates at arm’s length across a potentially degraded network, whereas on-box remediation is faster, simpler, and more likely to succeed.
Not every system lives in a monitored environment. Comprehensive monitoring is a significant investment. For systems that haven’t cleared that bar, on-box supervision is all there is. Treating external monitoring as the canonical answer denies local agency to most deployments.
Package maintainers are uniquely positioned to raise the floor across the entire ecosystem — they understand the protocol, they know the failure modes, and they already integrate to systemd. Critically, they touch every deployment and define what “out of the box” means at scale. A health-check plugin interface would let them ship a sensible probe alongside the unit file: one that works without operator intervention, covers some real-world failures by default, and creates inertia for local improvement where credentials or deeper local knowledge are required. They can’t ship a default that remediates through your monitoring system.
Local remediation is not universally appropriate, and in some cases it can be actively harmful. A supervisor that aggressively recycles a service still initializing can cause more harm than the original failure. Letting a failed service sit long enough to be examined preserves forensic value. These are real concerns.
But the convention also tends to overlook the case for local remediation entirely, ignoring that these same risks are already present in existing restart mechanisms and are managed with well-understood controls, and instead treating alerting as a sufficient answer when the correct answer is often both.
At its root, this convention is largely an artifact of what was available when the problem was first encountered at scale: external monitoring existed; a local health-check primitive did not. Practice hardened around the tools that were there, and that hardening had consequences. Package maintainers lost the opportunity to define sensible defaults for the software they understood best, and many deployments — particularly those without comprehensive monitoring — lost their most practical path to self-remediation.
The Limits of Local Supervision
While systemd’s limitations — like opt-in restarts and shallow health checks — are mitigatable through unit edits or sidecar watchdogs, these fixes ignore a fundamental architectural boundary. A supervisor running on a host cannot survive the death of that host. When hardware fails, everything on it disappears simultaneously — the application, the supervisor, the monitoring agent, all of it. There is nothing left to detect the failure or act on it.
Solving that requires crossing a physical boundary — detection and recovery logic must run somewhere else, on separate hardware that can observe the loss and respond to it.
Whether it’s worth investing further in systemd depends entirely on how you’re crossing that boundary — and the answer splits along organizational history in a way that’s worth understanding before you commit.
Enterprise shops that came to HA through Cluster Resource Management — already running Veritas Cluster Server, HACMP, or Sun Cluster before virtualization arrived — didn’t abandon that investment when VM HA appeared. VM HA was genuinely novel, but it was a simplification: it solved hardware failure more easily while discarding several things CRM already handled. It was an additional layer, not a replacement, and the CRM deployment persisted because it had already been made and it covered ground VM HA doesn’t touch.
SMB and mid-market either ignored the problem (most of them, most of the time) or discovered it coincidentally around the same time VMware was making Hypervisor-level HA trivially easy to enable. CRM never entered the conversation — not because it was evaluated and rejected, but because it was never seriously considered.
To understand what CRM covers that VM HA doesn’t — and why that gap matters — we have to look at what each model actually does.
Cluster Resource Management
The core idea is simple: instead of one server running the workload, there are two. One is active, one stands by. Because they are separate physical systems, each can observe the other across that hardware boundary — and when the active node fails or is taken out of service, the standby has both the awareness and the mechanism to take over.
Whether the transition is unplanned (a node failure) or planned (maintenance), the result is the same: the service goes offline momentarily while the standby takes over.
The now-standby node can be patched, rebooted, reconfigured, replaced, or otherwise wrenched on at whatever pace the work requires. The service remains available throughout.
Hypervisor-Level HA
VM HA operates at the hypervisor layer, coordinating across physical hosts. When a host fails, the workload is restarted on another — automatically. Live migration goes further: a running workload can be evacuated to another host with no interruption for planned host maintenance.
What it does not address is anything occurring inside the guest: a process that has died, a service that is running but off in the weeds, or maintenance that requires the guest itself to come down.
The Case for Cluster Resource Management
If the hypervisor will keep your VM running through hardware failure, and evacuate it without interruption for host maintenance, what do you need a standby node for?
Hypervisor-Level HA as a Cluster Resource Management replacement is a category error.
- Hardware failure is visible and named. People solve it.
- Service failure is invisible and unnamed. People absorb it.
- Hypervisor-Level HA solves #1. It does not touch #2.
- Cluster Resource Management solves both.
- Substituting #3 for #4 leaves #2 unaddressed — and unrecognized.
Concretely illustrated:
The order entry application maintains persistent connections to its database server. During network maintenance, a device in the network path was rebooted — sniping those connections. The application made no attempt to reconnect. It simply hung, despite the fact that a retry would have succeeded. Only restarting the application resolved it. Throughout the outage, the login page loaded fine; only attempting login surfaced the error. Catching this proactively would require a synthetic check that exercises a full user login, not just an HTTP 200 on the login page.
This is actually a pretty typical scenario, and it’s something that a well-configured CRM would have detected and resolved within about 60 seconds, avoiding an outage that would otherwise have been prolonged and ultimately reported by customers.
Meanwhile, you’re fielding “why didn’t the failover work?”
What makes this insidious is that various incidents appear unrelated, preventing pattern recognition. Each incident presents as a local, self-contained hiccup, and is therefore resolved in isolation. The result is continued treatment of symptoms while the absence of health-aware supervision remains unrecognized.
Guest maintenance still requires the guest to come down. Live migration handles host maintenance elegantly. It does nothing for OS patching or any other work that requires rebooting the VM itself.
The standby instance absorbs failures that happen during maintenance.
- Maintenance can break mid-way.
- Snapshots exist but reverting has real costs — lost work, lost context, deferred problem.
- In practice you don’t revert. You work through it.
With Cluster Resource Management, that work happens on the standby node. Whatever goes wrong, goes wrong there, while the active system continues serving production. Without a standby, the same failures unfold on the only instance you have.
The standby instance is a resource you can’t fully predict how you’ll use.
- Failure scenarios are unpredictable in their specifics.
- The runbook will be wrong in some way.
- The standby is what gives you room to adapt when it is.
- You can’t enumerate its value in advance — you just know from experience that you’ll need it.
HA Cluster Lab Build
Physical / Hypervisor Layer
| Host | Role |
|---|---|
| Dell PowerEdge R620 Node A | Proxmox VE — pve1.lab5.decoursey.com (192.168.4.231) — iDRAC7 (192.168.4.241) |
| Dell PowerEdge R620 Node B | Proxmox VE — pve2.lab5.decoursey.com (192.168.4.232) — iDRAC7 (192.168.4.242) |
Network Segments
| Bridge | Segment | Purpose |
|---|---|---|
| vmbr0 | Home network | Proxmox mgmt, TrueNAS mgmt |
| vmbr1 | 10.0.5.0/24 | Internal — RHEL cluster traffic, PostgreSQL |
| vmbr2 | 192.168.2.0/24 | iSCSI storage path 1 |
| vmbr3 | 192.168.3.0/24 | iSCSI storage path 2 (multipath) |
Machines obtained second-hand. BIOS and firmware flashed to latest and explicitly restored to factory default settings. BIOS Version 2.9.0 / iDRAC Firmware 2.65.65.65.
Virtual Machine Inventory
| VM | VMID | Role | Proxmox Host |
|---|---|---|---|
| VyOS | 100 | NAT Gateway | pve1 |
| TrueNAS SCALE | 101 | iSCSI SAN | pve1 |
| rhel1 | 121 | Cluster Node 1 | pve1 |
| rhel2 | 222 | Cluster Node 2 | pve2 |
IP Address Plan
| Host | Interface | IP | Purpose |
|---|---|---|---|
| TrueNAS | NIC1 | DHCP reservation | Management |
| TrueNAS | NIC2 | 192.168.2.1/24 | iSCSI portal 1 |
| TrueNAS | NIC3 | 192.168.3.1/24 | iSCSI portal 2 |
| rhel1 | ens18 | 10.0.5.21/24 | Internal / cluster |
| rhel1 | ens19 | 192.168.2.21/24 | iSCSI path 1 |
| rhel1 | ens20 | 192.168.3.21/24 | iSCSI path 2 |
| rhel2 | ens18 | 10.0.5.22/24 | Internal / cluster |
| rhel2 | ens19 | 192.168.2.22/24 | iSCSI path 1 |
| rhel2 | ens20 | 192.168.3.22/24 | iSCSI path 2 |
| Cluster VIP | — | 10.0.5.200/24 | Floating VIP (Pacemaker managed) |
Storage Layout
| Layer | Name | Details |
|---|---|---|
| TrueNAS pool | tank | ZFS pool on virtual disk |
| zvol | tank/cluster1 | 20GB block device |
| iSCSI target | iqn.2005-10.org.freenas.ctl:cluster1 | Two portals |
| Multipath device | /dev/mapper/mpatha | Two paths assembled |
| WWN | 36589cfc00000069a44bab397d95776b4 | Immutable device identifier |
| udev symlink | /dev/clusterstorage/cluster1 | Stable name by WWN |
| LVM PV/VG/LV | vg-cluster1 / lv-cluster1 | 18G, system_id protected |
| Filesystem | XFS on /mnt/cluster1 | Managed by Pacemaker |
| PostgreSQL data | /mnt/cluster1/pgsql/data | On shared storage |
Phase 1 — TrueNAS iSCSI SAN
TrueNAS is deployed as a virtual appliance directly attached to two dedicated storage network segments, in support of multipath I/O. Storage traffic is kept at Layer 2, with cluster nodes similarly attached to the same segments — no routing in the storage path.
VM: 2 vCPU, 8GB RAM, 3 NICs (vmbr0/vmbr2/vmbr3), separate data disk for ZFS.
Storage network interfaces:
| NIC | IP |
|---|---|
| NIC2 | 192.168.2.1/24 |
| NIC3 | 192.168.3.1/24 |
ZFS pool and zvol:
- Pool:
tank— stripe, single disk (lab only) - Zvol:
cluster1— 20GB, sync disabled (lab), lz4 compression
iSCSI configuration:
| Component | Value |
|---|---|
| Portal 1 | 192.168.2.1:3260 |
| Portal 2 | 192.168.3.1:3260 |
| Target | iqn.2005-10.org.freenas.ctl:cluster1 (auto-generated) |
| Initiator group | Allow all |
| LUN 0 | zvol/tank/cluster1 |
Phase 2 — RHEL Node Network Configuration
# Storage NICs — run on each node, adjust last octet (.21 / .22)
nmcli connection add type ethernet ifname ens19 con-name storage1 \
    ipv4.method manual ipv4.addresses 192.168.2.21/24 \
    ipv4.gateway "" ipv4.dns "" connection.autoconnect yes
nmcli connection up storage1

nmcli connection add type ethernet ifname ens20 con-name storage2 \
    ipv4.method manual ipv4.addresses 192.168.3.21/24 \
    ipv4.gateway "" ipv4.dns "" connection.autoconnect yes
nmcli connection up storage2
Phase 3 — iSCSI Initiator and Multipath (both nodes)
# Unique IQN per node
echo "InitiatorName=iqn.2024-01.com.lab:rhel1" > /etc/iscsi/initiatorname.iscsi

systemctl enable iscsid --now

iscsiadm -m discovery -t sendtargets -p 192.168.2.1
iscsiadm -m discovery -t sendtargets -p 192.168.3.1

# Configure multipath BEFORE login
mpathconf --enable --with_multipathd y

cat > /etc/multipath.conf << 'EOF'
defaults {
    user_friendly_names yes
    find_multipaths yes
    no_path_retry "fail"
}
blacklist {
    devnode "^sda"
}
overrides {
    no_path_retry "fail"
    features "0"
}
EOF

systemctl enable multipathd --now
iscsiadm -m node --loginall=automatic
systemctl enable iscsi --now
Verified:
mpatha (36589cfc00000069a44bab397d95776b4) dm-3 TrueNAS,iSCSI Disk
size=20G
|- sdb  active ready running
`- sdc  active ready running
udev rule (both nodes):
cat > /etc/udev/rules.d/99-iscsi-cluster.rules << 'EOF'
ENV{DM_UUID}=="mpath-36589cfc00000069a44bab397d95776b4", SYMLINK+="clusterstorage/cluster1"
EOF

mkdir -p /dev/clusterstorage
udevadm control --reload-rules
udevadm trigger --subsystem-match=block
Result: /dev/clusterstorage/cluster1 → dm-3 ✓
Phase 4 — LVM on Shared Storage
LVM system_id — exclusive activation protection
system_id stamps the VG with the owning node’s identity. LVM refuses to
activate a VG owned by a different system_id. Pacemaker’s LVM-activate
resource agent updates the system_id during failover handoff.
# Both nodes — set system_id source in lvm.conf
sed -i 's/# system_id_source = "none"/system_id_source = "uname"/' \
    /etc/lvm/lvm.conf
system_id_source = "uname" uses uname -n (FQDN) as the system_id.
# rhel1 only — create LVM stack
pvcreate /dev/clusterstorage/cluster1
vgcreate vg-cluster1 /dev/clusterstorage/cluster1
lvcreate -L 18G -n lv-cluster1 vg-cluster1

# Stamp VG with rhel1's identity
vgchange --systemid rhel1.lab5.decoursey.com vg-cluster1

# Format and test
mkfs.xfs /dev/vg-cluster1/lv-cluster1

# Disable autoactivation — flag lives in shared VG metadata, propagates to all nodes
vgchange --setautoactivation n vg-cluster1
Do NOT add to /etc/fstab — Pacemaker owns this mount exclusively.
Phase 5 — Build rhel2 and Validate Shared Storage
# RHEL 9 LVM devices file — must add shared device per node
lvmdevices --adddev /dev/clusterstorage/cluster1
pvscan --cache /dev/clusterstorage/cluster1
Failure symptom if skipped: excluded by devices file (checking PVID)
rhel2 protection confirmed:
Cannot access VG vg-cluster1 with system ID rhel1.lab5.decoursey.com
with local system ID rhel2.lab5.decoursey.com.
Post-reboot state (both nodes):
lv-cluster1 vg-cluster1 -wi------- 18.00g
Not active, not open. Pacemaker owns activation exclusively. ✓
Phase 6 — Pacemaker/Corosync Cluster
6.1 Install Packages (both nodes)
subscription-manager repos --enable=rhel-9-for-x86_64-highavailability-rpms
dnf install -y pacemaker pcs fence-agents-all
Versions: pacemaker 2.1.10, pcs 0.11.10, corosync 3.1.9, fence-agents-all 4.10.0
6.2 Pre-cluster Setup (both nodes)
# Scope high-availability ports to the peer node only — not broadly open
# On rhel1:
firewall-cmd --permanent --add-rich-rule='rule family=ipv4 source address=10.0.5.22 service name=high-availability accept'
# On rhel2:
firewall-cmd --permanent --add-rich-rule='rule family=ipv4 source address=10.0.5.21 service name=high-availability accept'

firewall-cmd --reload
passwd hacluster
systemctl enable pcsd --now
6.3 Hostname Resolution
Required before pcs host auth — added to /etc/hosts on both nodes:
10.0.5.21       rhel1 rhel1.lab5.decoursey.com
10.0.5.22       rhel2 rhel2.lab5.decoursey.com
192.168.4.231   pve1 pve1.lab5.decoursey.com
192.168.4.232   pve2 pve2.lab5.decoursey.com
6.4 Create Cluster (rhel1 only)
pcs host auth rhel1 rhel2 -u hacluster -p [password]
pcs cluster setup mycluster rhel1 rhel2 --start --enable
6.5 fence_pve Installation (both nodes)
fence_pve is not in RHEL fence-agents packages:
curl -o /usr/sbin/fence_pve \
    https://raw.githubusercontent.com/ClusterLabs/fence-agents/main/agents/pve/fence_pve.py
sed -i 's/#!@PYTHON@ -tt/#!\/usr\/bin\/python3/' /usr/sbin/fence_pve
chmod +x /usr/sbin/fence_pve
ln -s /usr/share/fence/fencing.py /usr/lib/python3.9/site-packages/fencing.py
Notes: Proxmox GitHub tarball is Python 2 — do not use. Use --shell-timeout=300.
6.6 STONITH Design and Fencing Topology
Each fence resource targets the hypervisor hosting the target VM — KISS.
fence-rhel1 → pve1 fence-rhel2 → pve2
Delay configuration:
In a simultaneous partition both nodes try to fence each other. Without a
tiebreaker both get fenced. pcmk_delay_base and pcmk_delay_max on
fence-rhel2 make rhel1 the designated loser — fence-rhel1 fires immediately
from rhel2, fence-rhel2 waits 15-45 seconds. rhel2 wins the fencing race
and keeps/takes resources.
pcs stonith update fence-rhel2 pcmk_delay_base=15s pcmk_delay_max=30s
Known limitation: If pve1 or pve2 fails, fencing the VM on that hypervisor fails and automatic failover stalls. iDRAC fencing rejected as fallback — fences entire physical host, unacceptable blast radius. Accepted as lab limitation. See design decisions section.
6.7 STONITH Resources
pcs stonith create fence-rhel1 fence_pve \
    ip=pve1.lab5.decoursey.com username=pacemaker@pve password=[password] \
    plug=121 ssl_insecure=1 pve_node_auto=1 vmtype=qemu shell_timeout=300 \
    pcmk_host_list=rhel1 op monitor interval=60s

pcs stonith create fence-rhel2 fence_pve \
    ip=pve2.lab5.decoursey.com username=pacemaker@pve password=[password] \
    plug=222 ssl_insecure=1 pve_node_auto=1 vmtype=qemu shell_timeout=300 \
    pcmk_delay_base=15s pcmk_delay_max=30s \
    pcmk_host_list=rhel2 op monitor interval=60s

pcs constraint location fence-rhel1 avoids rhel1
pcs constraint location fence-rhel2 avoids rhel2
Location constraints ensure each node runs the fence resource for the other node — correct STONITH placement.
6.8 PostgreSQL on Shared Storage
dnf install -y postgresql-server postgresql
postgresql-setup --initdb
systemctl disable postgresql
firewall-cmd --permanent --add-service=postgresql
firewall-cmd --reload
postgresql.conf: listen_addresses = '*', port = 5432
pg_hba.conf: host all all 10.0.5.0/24 md5
Data directory on shared storage (rhel1 only):
vgchange -ay vg-cluster1
mount /dev/vg-cluster1/lv-cluster1 /mnt/cluster1
mkdir -p /mnt/cluster1/pgsql/data
chown -R postgres:postgres /mnt/cluster1/pgsql
chmod 700 /mnt/cluster1/pgsql/data
cp -a /var/lib/pgsql/data/. /mnt/cluster1/pgsql/data/
umount /mnt/cluster1
vgchange -an vg-cluster1
6.9 SELinux Context on Shared Storage
Critical: Pacemaker’s resource agents run in confined SELinux contexts.
Mount points with unlabeled_t cannot be traversed. Manual postgres
invocations use unconfined root context — this masks the problem.
Diagnosis: could not change directory: Permission denied in pacemaker.log
despite correct Unix permissions.
Fix:
chcon -t mnt_t /mnt/cluster1
chcon -R -t postgresql_db_t /mnt/cluster1/pgsql
Persistence: Labels stored in XFS extended attributes on the shared filesystem — travel with the data, survive unmount/remount on any node. Set once, correct everywhere.
getfattr -n security.selinux /mnt/cluster1
# system_u:object_r:mnt_t:s0
getfattr -n security.selinux /mnt/cluster1/pgsql
# unconfined_u:object_r:postgresql_db_t:s0
Additional SELinux work required for monitoring is covered in section 8.7.
6.10 Resource Stack
pcs resource create pg-lvm LVM-activate \
    vgname=vg-cluster1 lvname=lv-cluster1 \
    activation_mode=exclusive vg_access_mode=system_id \
    op monitor interval=30s timeout=30s OCF_CHECK_LEVEL=10

pcs resource create pg-fs Filesystem \
    device=/dev/vg-cluster1/lv-cluster1 \
    directory=/mnt/cluster1 fstype=xfs \
    op monitor interval=20s

pcs resource create pg-db ocf:heartbeat:pgsql \
    pgctl=/usr/bin/pg_ctl \
    pgdata=/mnt/cluster1/pgsql/data \
    op monitor interval=30s

pcs resource create pg-vip IPaddr2 \
    ip=10.0.5.200 cidr_netmask=24 \
    op monitor interval=10s

# Ordering
pcs constraint order pg-lvm then pg-fs
pcs constraint order pg-fs then pg-db
pcs constraint order pg-db then pg-vip

# Colocation
pcs constraint colocation add pg-fs with pg-lvm INFINITY
pcs constraint colocation add pg-db with pg-fs INFINITY
pcs constraint colocation add pg-vip with pg-db INFINITY
6.11 Final Cluster Status
Full List of Resources:
  * fence-rhel1 (stonith:fence_pve):     Started rhel2
  * fence-rhel2 (stonith:fence_pve):     Started rhel1
  * pg-lvm      (ocf:heartbeat:LVM-activate):    Started rhel1
  * pg-fs       (ocf:heartbeat:Filesystem):      Started rhel1
  * pg-vip      (ocf:heartbeat:IPaddr2):         Started rhel1
  * pg-db       (ocf:heartbeat:pgsql):   Started rhel1
No errors. No warnings. ✓
Phase 7 — Failure Scenario Validation
This cluster was validated against four distinct failure scenarios representing different failure classes. Testing was not limited to the happy path — the goal was to exercise the full range of conditions a production HA implementation must handle correctly.
| # | Scenario | Failure Class | STONITH Fires | Recovery | Disruption |
|---|---|---|---|---|---|
| 1 | Graceful migration (pcs node standby) |
Planned maintenance | No | Automatic | ~7 sec |
| 2a | Corosync partition — active node partitioned | Split-brain risk | Yes | Automatic | ~16 sec |
| 2b | Corosync partition — standby node partitioned | Split-brain risk | Yes | No disruption | 0 sec |
| 3 | Hard VM power off (Proxmox Stop) | Hardware/hypervisor failure | Yes | Automatic | ~65 sec |
| 4 | PostgreSQL process kill (kill -9) |
Application crash | No | Automatic (in-place restart) | ~11 sec |
Test Setup
PostgreSQL test table and timestamped write loop used across all scenarios:
psql -h 10.0.5.200 -U postgres -d clustertest \
    -c "CREATE TABLE failover_test (id serial, ts timestamp);"

echo "10.0.5.200:5432:*:postgres:[password]" > ~/.pgpass
chmod 600 ~/.pgpass

while true; do
    result=$(psql -h 10.0.5.200 -U postgres -d clustertest \
        -c "INSERT INTO failover_test (ts) VALUES (now());" 2>&1)
    echo "$(date +%H:%M:%S) $result"
    sleep 1
done
Timestamps make the disruption window precisely measurable. The write loop client was always run from the node not holding resources so that client process survival was independent of the failover.
Scenario 1 — Graceful Migration
What was tested: pcs node standby rhel2 with resources running on rhel2.
Ordered shutdown and migration of all resources to rhel1.
Why it matters: Planned maintenance — patching, reboots, upgrades. The most common operational use of a cluster.
Result:
05:49:34  INSERT 0 1   ← last write on rhel2
05:49:38  No route to host
05:49:41  No route to host
05:49:42  INSERT 0 1   ← resumed on rhel1
7 second disruption. Orderly stop/start sequence. No STONITH. No data loss. 109 rows confirmed intact after migration. ✓
Scenario 2 — Corosync Partition (Split-Brain Risk)
What was tested: iptables rules blocking UDP port 5405 (corosync) between nodes. This simulates a network partition where both nodes are running but cannot see each other — the classic split-brain scenario that STONITH exists to prevent.
Why it matters: This is the scenario where data corruption is possible without proper fencing. Both nodes might believe they are the sole survivor and attempt to mount the same filesystem simultaneously. STONITH eliminates this risk by guaranteeing one node is dead before the other acts.
Tiebreaker configuration: Initial testing confirmed the mutual fencing scenario directly — both VMs powered off simultaneously. The delay configuration described in section 6.6 was added as a result and validated here.
Scenario 2a — Active node partitioned (resources on rhel1, rhel1 firewalled):
# On rhel1
iptables -I INPUT -s 10.0.5.22 -p udp --dport 5405 -j DROP
iptables -I OUTPUT -d 10.0.5.22 -p udp --dport 5405 -j DROP
rhel2 lost contact with rhel1, fired fence-rhel1 immediately. rhel1 rebooted via pve1 API. Resources migrated to rhel2. rhel1’s reboot cleared the iptables rules — rhel1 rejoined cluster cleanly on boot.
Write loop output:
05:49:02  INSERT 0 1   ← last write before partition
05:49:18  INSERT 0 1   ← resumed after rhel1 fenced and rhel2 took over
16 second disruption. STONITH fired. Resources migrated. Cluster self-healed. ✓
Scenario 2b — Standby node partitioned (resources on rhel2, rhel2 firewalled):
# On rhel2
iptables -I INPUT -s 10.0.5.21 -p udp --dport 5405 -j DROP
iptables -I OUTPUT -d 10.0.5.21 -p udp --dport 5405 -j DROP
rhel1 lost contact with rhel2. Fired fence-rhel2 immediately. rhel2 rebooted. Resources stayed on rhel2 throughout — rhel2 had quorum and the service never stopped. Write loop showed zero disruption.
Key insight: The surviving node simultaneously keeps the service running and reboots its partner — even if the partner was merely standby — to attempt automatic restoration of full redundancy. The goal is not just surviving the failure but returning to a healthy two-node cluster as quickly as possible.
On quorum and post-reboot behavior: When a fenced node reboots it starts corosync, sees it has only 1 of 2 votes (no quorum), and waits. It does not attempt to start resources or initiate fencing. It will not shoot back at the surviving node. Pacemaker’s quorum requirement is what prevents the rebooted node from causing further disruption. ✓
Scenario 3 — Hard VM Power Off
What was tested: Resources on rhel2. rhel2 hard-stopped from Proxmox UI (Stop — equivalent to pulling the power cord, no graceful shutdown).
Why it matters: Kernel panic, hypervisor crash, physical power failure. No graceful corosync goodbye — the node simply vanishes.
Result:
05:56:58  INSERT 0 1   ← last write before hard power off
05:58:03  INSERT 0 1   ← resumed after recovery
65 second disruption — longest of all scenarios. The primary driver is the
pcmk_delay_base=15s pcmk_delay_max=30s configured on fence-rhel2. When
rhel2 disappeared, rhel1 needed to fence rhel2 before taking over resources
— but fence-rhel2 carries the delay, so rhel1 had to wait it out before
firing. Once STONITH confirmed rhel2 was already off, resources migrated to
rhel1 normally.
rhel2 rejoined the cluster after STONITH-driven reboot, restoring full redundancy automatically. ✓
Scenario 4 — PostgreSQL Process Kill
What was tested: Resources on rhel1. PostgreSQL master process killed
with kill -9 $(pgrep -f "postgres -D") while write loop running from rhel2.
Why it matters: Application crash — segfault, OOM kill of the database process, runaway resource consumption. Node is healthy but the service is down.
Result:
06:02:21  INSERT 0 1        ← last write before kill -9
06:02:22  Connection refused ← postgres dead
06:02:23  Connection refused
06:02:24  Connection refused
06:02:32  INSERT 0 1        ← postgres restarted in place
11 second disruption — fastest of all scenarios. No STONITH. No resource migration. No storage handoff. Pacemaker’s 30-second monitor interval fired at 06:02:24, detected postgres not running, restarted it in place on rhel1. VIP never moved. LVM and filesystem never touched.
The pcs status retained a failed action record after recovery:
Failed Resource Actions:
  * pg-db 30s-interval monitor on rhel1 returned 'not running'
This is expected — Pacemaker records the event in history but the service
is running normally. Clear with pcs resource cleanup pg-db. In production
this record should trigger an alert — the cluster self-healed but the root
cause of the crash still needs investigation.
This distinction matters: a monitor failure triggers service restart on the same node. A start failure after restart triggers migration to the other node. STONITH is reserved for node-level failures where the node’s state is unknown. ✓
Validation Summary
All four failure classes tested. All recovered automatically without manual intervention. No data loss in any scenario.
The disruption times tell a story about the recovery path:
- 11 seconds — application crash (in-place restart, no infrastructure change)
- 7 seconds — graceful migration (ordered handoff, no uncertainty)
- 16 seconds — network partition (corosync timeout + STONITH + migration)
- 65 seconds — hard power off (longer corosync timeout + STONITH + migration)
Alerting consideration: The cluster self-healed in all scenarios. Per the design philosophy — if failover works, you won’t see an outage. But you still need to know it happened. Pacemaker logs all state transitions and failed resource actions. These should feed into a monitoring system so the operations team is notified even when the impact to users was minimal or zero. The absence of an outage is not the same as the absence of a problem.
Phase 8 — Monitoring and Alerting
8.1 Monitoring Architecture
The Research Gap Initial research into Pacemaker/Nagios integration confirmed a lack of official, “out-of-the-box” tooling. The established community standard relies on deploying NRPE to cluster nodes and using custom wrapper scripts to parse crm_mon output. While we successfully implemented and validated this polling method, it revealed a significant architectural limitation.
The Polling Limitation Because Pacemaker is designed to detect and resolve failures within seconds, a standard polling interval (e.g., 60 seconds) only captures the instantaneous state of the cluster. This creates a “blind spot” where transient but critical events — such as resource restarts or fencing (STONITH) actions — can occur and resolve entirely between polls, leaving Nagios unaware of the underlying instability.
The Integrated Solution To bridge this gap, we moved beyond simple polling to implement a dual-layer monitoring strategy. This involves leveraging Pacemaker’s native Alert Agent mechanism to provide real-time, event-driven notifications.
Two distinct monitoring mechanisms are therefore in place:
Active polling — Nagios polls cluster nodes on a regular interval via NRPE,
running a check script that parses crm_mon output. This catches persistent
problems: a node that is offline and stays offline, a resource that fails and
does not recover, a cluster that has lost quorum. It does not catch transient
events that resolve before the next poll.
Event-driven passive checks — Pacemaker fires an alert agent script on every state change event. The script submits a passive check result to Nagios immediately via NSCA-ng, with no polling involved. This catches everything the polling misses: node offline, STONITH fired, node rejoined, resource failed and recovered. The event appears in Nagios within seconds regardless of the polling interval.
8.2 Components Deployed
On the Nagios monitoring host (10.0.5.12):
| Component | Package | Purpose |
|---|---|---|
| Nagios Core | nagios (EPEL) | Monitoring engine and web UI |
| NRPE plugin | nagios-plugins-nrpe (EPEL) | Client for executing remote checks |
| PostgreSQL plugin | nagios-plugins-pgsql (EPEL) | Direct PostgreSQL connectivity check |
| NSCA-ng server | nsca-ng-server (EPEL) | Receives passive check results from cluster nodes |
On both cluster nodes (rhel1, rhel2):
| Component | Package/File | Purpose |
|---|---|---|
| NRPE daemon | nrpe (EPEL) | Executes check commands on behalf of Nagios |
| Standard plugins | nagios-plugins-disk, nagios-plugins-load (EPEL) | Disk and load checks |
| NSCA-ng client | nsca-ng-client (EPEL) | Submits passive check results to Nagios |
| check_pacemaker | /usr/lib64/nagios/plugins/check_pacemaker | Custom script — parses crm_mon output |
| alert_nsca.sh | /usr/share/pacemaker/alerts/alert_nsca.sh | Pacemaker alert agent |
| nrpe-pacemaker | /etc/sudoers.d/nrpe-pacemaker | Allows nrpe to run crm_mon via sudo |
| send_nsca.cfg | /etc/send_nsca.cfg | NSCA-ng client configuration |
Firewall rules added on cluster nodes:
# NRPE — allow from Nagios host only
firewall-cmd --permanent --add-rich-rule='rule family=ipv4 source address=10.0.5.12 port port=5666 protocol=tcp accept'
firewall-cmd --reload
Firewall rules added on Nagios host:
# NSCA-ng — allow from cluster network
firewall-cmd --permanent --add-rich-rule='rule family=ipv4 source address=10.0.5.0/24 port port=5668 protocol=tcp accept'
firewall-cmd --reload
8.3 Active Polling Checks
All active checks run from the Nagios host via NRPE or direct network connection:
| Service | Host | Method | What It Catches |
|---|---|---|---|
| Pacemaker Status | rhel1, rhel2 | NRPE → check_pacemaker | Node offline, resource failed, no quorum, fail-count |
| Disk / | rhel1, rhel2 | NRPE → check_disk | Filesystem usage threshold |
| Load | rhel1, rhel2 | NRPE → check_load | CPU load average threshold |
| PostgreSQL | cluster-vip | Direct → check_pgsql | Database connectivity via floating VIP |
Note: The PostgreSQL check runs directly from the Nagios host against the floating VIP — testing reachability, connectivity, and authentication from a hypothetical external client’s perspective rather than from within the cluster.
NRPE commands defined in /etc/nagios/nrpe.cfg (both nodes):
command[check_disk]=/usr/lib64/nagios/plugins/check_disk -w 20% -c 10% -p /
command[check_load]=/usr/lib64/nagios/plugins/check_load -r -w .15,.10,.05 -c .30,.25,.20
command[check_pacemaker]=/usr/lib64/nagios/plugins/check_pacemaker -w
8.4 check_pacemaker
No suitable pre-packaged Nagios plugin existed for Pacemaker cluster health on
RHEL 9. The check_crm Perl script (Sysnix Consultants, 2011) requires
Nagios::Plugin which is not available in EPEL. The script itself was widely
referenced in its era and covered the relevant cases thoughtfully — standby
detection, fail-count, fence resource suppression. On the reasonable presumption
that its design was well-informed, a bash equivalent was written to the same
specification rather than approaching the problem from scratch.
The script runs sudo /usr/sbin/crm_mon -1 -r -f and parses the output for:
- Loss of quorum
- Offline nodes (reported by name)
- Nodes in standby (WARNING with
-wflag, CRITICAL otherwise) - Stopped non-fence resources (fence resources stopping when their host goes offline is expected behavior, suppressed to avoid misleading output)
- Failed resource actions
- Resources with non-zero fail-count
The -w flag is used in the NRPE command definition — standby is a valid
operational state (planned maintenance) and should not page on-call.
#!/bin/bash
#
# check_pacemaker - Nagios check for Pacemaker cluster health
# Parses crm_mon output and reports cluster state
#
# Exit codes: 0=OK, 1=WARNING, 2=CRITICAL
#
# Usage: check_pacemaker [-w]
#   -w  Treat offline nodes, stopped resources, and standby nodes as
#       WARNING instead of CRITICAL (as long as quorum exists)
#

WARN_ONLY=0
while getopts "w" opt; do
    case $opt in
        w) WARN_ONLY=1 ;;
    esac
done

WARN_OR_CRIT=2
[ $WARN_ONLY -eq 1 ] && WARN_OR_CRIT=1

CRM_MON=/usr/sbin/crm_mon
SUDO=/usr/bin/sudo

OUTPUT=$($SUDO $CRM_MON -1 -r -f 2>&1)
if [ $? -ne 0 ]; then
    echo "CRITICAL: Failed to run crm_mon"
    exit 2
fi

WORST=0
MESSAGES=()

if echo "$OUTPUT" | grep -qi "connection to cluster failed"; then
    echo "CRITICAL: Connection to cluster failed"
    exit 2
fi

if echo "$OUTPUT" | grep -q "Current DC:"; then
    if ! echo "$OUTPUT" | grep -q "partition with quorum$"; then
        MESSAGES+=("No Quorum")
        WORST=2
    fi
fi

OFFLINE=$(echo "$OUTPUT" | grep -i "^\s*\*\s*OFFLINE:" | grep -oP '\[.*?\]' | tr -d '[]')
if [ -n "$OFFLINE" ]; then
    MESSAGES+=("Node(s) OFFLINE:$OFFLINE")
    [ $WARN_OR_CRIT -gt $WORST ] && WORST=$WARN_OR_CRIT
fi

STANDBY=$(echo "$OUTPUT" | grep -i "^node.*standby" | awk '{print $2}' | tr '
' ' ')
if [ -n "$STANDBY" ]; then
    MESSAGES+=("Node(s) in standby: $STANDBY")
    [ $WARN_OR_CRIT -gt $WORST ] && WORST=$WARN_OR_CRIT
fi

STOPPED=$(echo "$OUTPUT" | grep -E '\(.*\).*Stopped' | grep -v 'fence' | awk '{print $2}' | tr '
' ' ')
if [ -n "$STOPPED" ]; then
    MESSAGES+=("Stopped resources: $STOPPED")
    [ $WARN_OR_CRIT -gt $WORST ] && WORST=$WARN_OR_CRIT
fi

if echo "$OUTPUT" | grep -q "^Failed actions:"; then
    MESSAGES+=("FAILED actions detected or not cleaned up")
    [ 2 -gt $WORST ] && WORST=2
fi

FAILCOUNT=$(echo "$OUTPUT" | grep 'fail-count=[1-9]' | awk '{print $2}' | tr -d ':' | tr '
' ' ')
if [ -n "$FAILCOUNT" ]; then
    MESSAGES+=("Failure detected on: $FAILCOUNT")
    [ 1 -gt $WORST ] && WORST=1
fi

[ ${#MESSAGES[@]} -eq 0 ] && MESSAGES+=("Cluster OK")

MSG=$(IFS=', '; echo "${MESSAGES[*]}")
case $WORST in
    0) echo "OK: $MSG" ;;
    1) echo "WARNING: $MSG" ;;
    2) echo "CRITICAL: $MSG" ;;
esac
exit $WORST
sudo configuration (both nodes):
# /etc/sudoers.d/nrpe-pacemaker
Defaults:nrpe !requiretty
Defaults:nrpe timestamp_timeout=0
nrpe ALL=(root) NOPASSWD: /usr/sbin/crm_mon
8.5 Event-Driven Alerting
The more complete integration. Pacemaker has native support for external notification via what it calls alert agents — scripts it executes on every state change event, passing event details as environment variables. The agent can take any action; here it submits a passive check result to Nagios via NSCA-ng, a secure authenticated channel for delivering check results without polling.
Pipeline:
Pacemaker state change
  → alert_nsca.sh (alert agent, runs on cluster node)
    → send_nsca (NSCA-ng client)
      → nsca-ng (NSCA-ng server on Nagios host, port 5668)
        → Nagios command pipe
          → Nagios passive check result
Alert agent registered with Pacemaker:
pcs alert create id=nsca-alert path=/usr/share/pacemaker/alerts/alert_nsca.sh
pcs alert recipient add nsca-alert id=nsca-recipient value=nagios
The alert agent fires on node events, resource events, and fencing events.
Results are submitted against the Pacemaker Events passive service on the
node the event concerns — not necessarily the node submitting the result.
When rhel1 reports that rhel2 is offline, Nagios correctly marks rhel2’s
Pacemaker Events service as CRITICAL.
NSCA-ng server configuration (/etc/nsca-ng.cfg on Nagios host):
command_file = "/var/spool/nagios/cmd/nagios.cmd"

authorize "*" {
    password = "[password]"
    hosts = ".*"
    services = ".*"
}
NSCA-ng client configuration (/etc/send_nsca.cfg on cluster nodes):
server = "10.0.5.12"
port = "5668"
password = "[password]"
8.6 alert_nsca.sh
Pacemaker injects event details as environment variables before invoking the alert agent. Key variables used:
| Variable | Content |
|---|---|
| CRM_alert_kind | Event type: node, resource, fencing |
| CRM_alert_node | Node where event occurred |
| CRM_alert_desc | Human-readable state: member, lost, standby |
| CRM_alert_rsc | Resource name (resource events) |
| CRM_alert_task | Action: start, stop, monitor (resource events) |
| CRM_alert_rc | Return code — non-zero indicates failure |
| CRM_alert_target | Fencing target (fencing events) |
#!/bin/bash
#
# alert_nsca.sh - Pacemaker alert agent
# Submits passive check results to Nagios via NSCA-ng on cluster state changes
#

NAGIOS_HOST="10.0.5.12"
NSCA_CFG="/etc/send_nsca.cfg"
SERVICE_DESC="Pacemaker Events"

case "$CRM_alert_kind" in
    node)
        case "$CRM_alert_desc" in
            member)
                STATUS=0
                MSG="Node $CRM_alert_node is now online"
                ;;
            lost)
                STATUS=2
                MSG="Node $CRM_alert_node is now OFFLINE"
                ;;
            *)
                STATUS=1
                MSG="Node $CRM_alert_node state changed: $CRM_alert_desc"
                ;;
        esac
        printf "%s	%s	%s	%s
" \
            "$CRM_alert_node" "$SERVICE_DESC" "$STATUS" "$MSG" | \
            send_nsca -H "$NAGIOS_HOST" -c "$NSCA_CFG"
        ;;
    resource)
        if [ "$CRM_alert_rc" != "0" ]; then
            STATUS=2
            MSG="FAILED: $CRM_alert_rsc $CRM_alert_task on $CRM_alert_node (rc=$CRM_alert_rc)"
        else
            STATUS=0
            MSG="OK: $CRM_alert_rsc $CRM_alert_task on $CRM_alert_node"
        fi
        printf "%s	%s	%s	%s
" \
            "$CRM_alert_node" "$SERVICE_DESC" "$STATUS" "$MSG" | \
            send_nsca -H "$NAGIOS_HOST" -c "$NSCA_CFG"
        ;;
    fencing)
        STATUS=2
        MSG="STONITH: $CRM_alert_node fenced $CRM_alert_target"
        printf "%s	%s	%s	%s
" \
            "$CRM_alert_node" "$SERVICE_DESC" "$STATUS" "$MSG" | \
            send_nsca -H "$NAGIOS_HOST" -c "$NSCA_CFG"
        ;;
esac
8.7 SELinux Configuration
SELinux enforcement on RHEL 9 is aggressive around anything that crosses privilege or domain boundaries — and monitoring does exactly that: NRPE runs as the nrpe confined user, executes sudo to reach root-owned tools, which then communicate with cluster daemons via Unix sockets. Each crossing requires explicit permission.
The pattern is consistent across all monitoring checks: set the nrpe_t domain to permissive to allow execution while logging all denials, exercise the check, capture everything with audit2allow, build policy modules, return to enforcing.
Booleans (both nodes):
setsebool -P nagios_run_sudo 1
setsebool -P daemons_enable_cluster_mode 1
nagios_run_sudo allows the NRPE process to execute sudo. daemons_enable_cluster_mode allows crm_mon to connect to the Pacemaker/Corosync socket.
Policy modules — check_pacemaker (both nodes):
semanage permissive -a nrpe_t
/usr/lib64/nagios/plugins/check_nrpe -H localhost -c check_pacemaker
ausearch -c 'sudo' --raw | audit2allow -M nagios-sudo
semodule -X 300 -i nagios-sudo.pp
ausearch -c 'crm_mon' --raw | audit2allow -M nagios-crm
semodule -X 300 -i nagios-crm.pp
semanage permissive -d nrpe_t
Policy modules — check_multipath (both nodes):
semanage permissive -a nrpe_t
/usr/lib64/nagios/plugins/check_multipath
ausearch -c 'check_multipath' --raw | audit2allow -M nagios-multipath
semodule -X 300 -i nagios-multipath.pp
ausearch -c 'multipathd' --raw | audit2allow -M nagios-multipathd
semodule -X 300 -i nagios-multipathd.pp
ausearch -c 'grep' --raw | audit2allow -M nagios-grep
semodule -X 300 -i nagios-grep.pp
semanage permissive -d nrpe_t
The grep execmem denial warrants a note — SELinux flags this as potentially serious since executable memory access by grep is unusual. In this context it is benign: grep running in the confined nrpe_t domain triggers a policy gap rather than indicating a real security issue. Reviewed and accepted.
Policy modules on rhel2 can be copied directly from rhel1 rather than rebuilt:
scp [email protected]:/root/nagios-*.pp /root/
semodule -X 300 -i nagios-sudo.pp nagios-crm.pp nagios-multipath.pp \
    nagios-multipathd.pp nagios-grep.pp
For shared storage contexts see section 6.9.
8.8 Validation
Active polling — PostgreSQL kill -9:
kill -9 $(pgrep -f "postgres -D")
Both cluster nodes immediately showed WARNING on Pacemaker Status —
fail-count detected on pg-db before Pacemaker restarted it. Resolved to OK
within the next poll cycle after pcs resource cleanup pg-db.
Event-driven alerting — node offline/STONITH/rejoin sequence:
The following sequence was captured in the nsca-ng log on the Nagios host during a hard power-off of rhel2 from the Proxmox UI:
20:04:52  rhel2;Pacemaker Events;2;Node rhel2 is now OFFLINE
20:05:25  rhel2;Pacemaker Events;2;STONITH: rhel2 fenced
20:05:59  rhel2;Pacemaker Events;0;Node rhel2 is now online
All three events reported from rhel1 — rhel2 was the subject of the events,
rhel1 was the surviving node reporting them. Nagios correctly attributed each
result to rhel2’s Pacemaker Events service. The Nagios UI showed rhel2 go
CRITICAL at 20:04:52 and return to OK at 20:05:59 — a 67 second window fully
captured without polling.
The STONITH event record in particular is significant. It remains in Nagios history after the node recovers, providing an audit trail: a fencing action occurred, at this timestamp, against this node. That record is what triggers the postmortem.
8.9 Multipath Failure Validation
This section validates the complete failure detection and recovery chain for total storage path loss — a failure mode that exposed significant gaps in the initial configuration and required deliberate work to solve correctly.
The Problem: Monitoring That Cannot See the Failure
With no_path_retry queue in the initial configuration, total loss of all
storage paths caused I/O to queue indefinitely in the kernel. PostgreSQL hung
waiting for I/O that would never complete. From every monitoring perspective
the system appeared healthy:
- Pacemaker: pg-db process running, filesystem mounted, VIP assigned — all monitors passing
- Nagios PostgreSQL check: accepting connections, returning results (lightweight queries not touching storage)
- Cluster heartbeat: both nodes online, quorum maintained
The service was completely non-functional. Nothing detected it.
This is the failure mode the introduction describes — not the server dying outright, but the service off in the weeds. And it is precisely the failure mode that naive HA configuration, naive monitoring, and naive multipath configuration conspire to hide.
The Fix: Three Layers Working Together
Layer 1 — multipath.conf:
no_path_retry queue is a common recommendation for standalone servers — it protects the OS from I/O errors by queuing until a path recovers, which is the right behavior when there is no higher-level mechanism to detect and respond to storage loss. In a cluster environment the calculus reverses: you specifically want I/O to fail so that Pacemaker receives the error signal needed to trigger resource failover. Red Hat’s own default for no_path_retry is actually fail, not queue — which means queue was never the right choice here, even if it is commonly seen in iSCSI examples.
Getting fail to actually take effect was not straightforward. Device-specific stanzas in the built-in multipath configuration matched TrueNAS’s generic iSCSI identification and silently overrode the defaults section. Additionally, a numeric no_path_retry value causes multipathd to inject queue_if_no_path into the kernel dm table automatically, regardless of what the config file says — so even intermediate attempts with no_path_retry 3 were not working as expected.
The overrides section beats device stanzas and applying no_path_retry "fail" there with features "0" to prevent the queue flag from being re-injected produced the correct result:
overrides {
    no_path_retry "fail"
    features "0"
}
This configuration warrants revisiting if the storage environment changes — on a standalone server, fail means applications receive I/O errors immediately on total path loss rather than waiting for recovery, which may not be desirable.
Layer 2 — Pacemaker OCF_CHECK_LEVEL=10:
With no_path_retry "fail" in place, total path loss returns EIO immediately
rather than queuing. The LVM-activate resource agent’s OCF_CHECK_LEVEL=10
monitor performs a raw read of the underlying block device. When that read
returns EIO, Pacemaker receives a clean failure signal and can act.
pcs resource update pg-lvm \
    op monitor interval=30s OCF_CHECK_LEVEL=10 timeout=30s
Layer 3 — Nagios multipath monitoring:
The check_multipath script monitors path health independently of Pacemaker,
providing early warning on single-path degradation before total loss occurs.
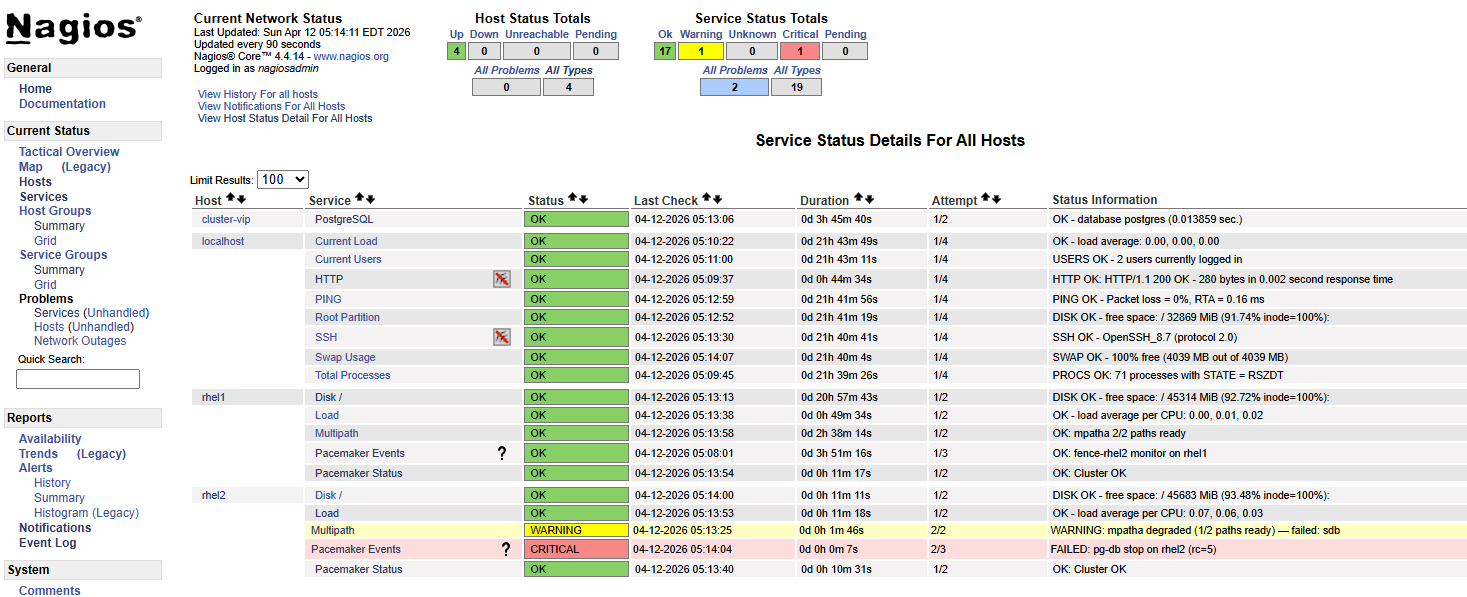
Validation — Total Storage Path Loss
Resources running on rhel2. Write loop running from rhel1 via floating VIP. Both physical storage cables pulled from rhel2 simultaneously.
Write loop output:
05:13:27  INSERT 0 1   ← last successful write before paths lost
05:13:44  PANIC: could not fdatasync file "...": Input/output error
          server closed the connection unexpectedly
05:13:45  Connection refused  ─┐
05:13:46  Connection refused   │  pg-db crashed, Pacemaker detecting
05:13:47  Connection refused   │  failure, STONITH firing against rhel2
          ...                  │
05:14:23  No route to host  ───┘  rhel2 fenced, VIP gone
05:14:27  No route to host
          ...
05:14:41  INSERT 0 1   ← resources up on rhel1, writes resume
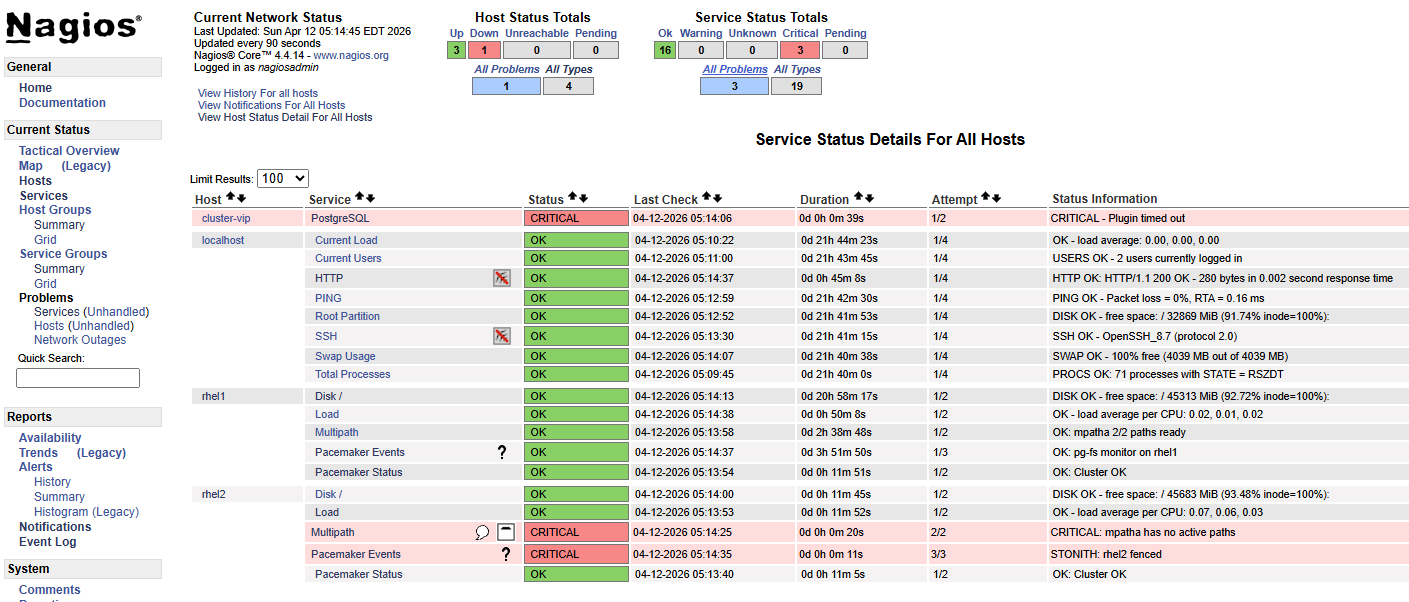
Total disruption: ~74 seconds.
The transition from Connection refused to No route to host marks the
STONITH moment — rhel2’s network interface disappears when the VM is fenced
via the Proxmox API.
Sequence of events:
- Both storage paths lost —
no_path_retry "fail"returns EIO immediately - PostgreSQL panics on fdatasync failure — process crashes cleanly
- Pacemaker pg-db monitor detects process gone — declares resource failed
- OCF_CHECK_LEVEL=10 LVM monitor detects storage failure independently
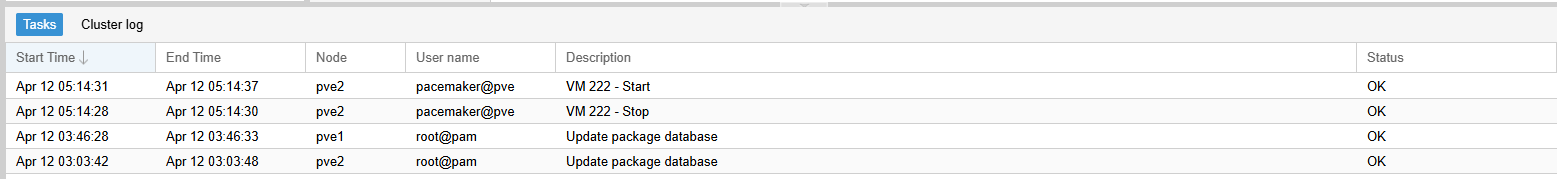
- STONITH fires against rhel2 via pve2 API
- Resources migrate to rhel1 — LVM activates, filesystem mounts, PostgreSQL starts
- VIP moves to rhel1 — client connections resume
Data integrity confirmed:
SELECT count(*) FROM failover_test;
All rows present. No data loss despite a storage-level I/O panic on the active node.
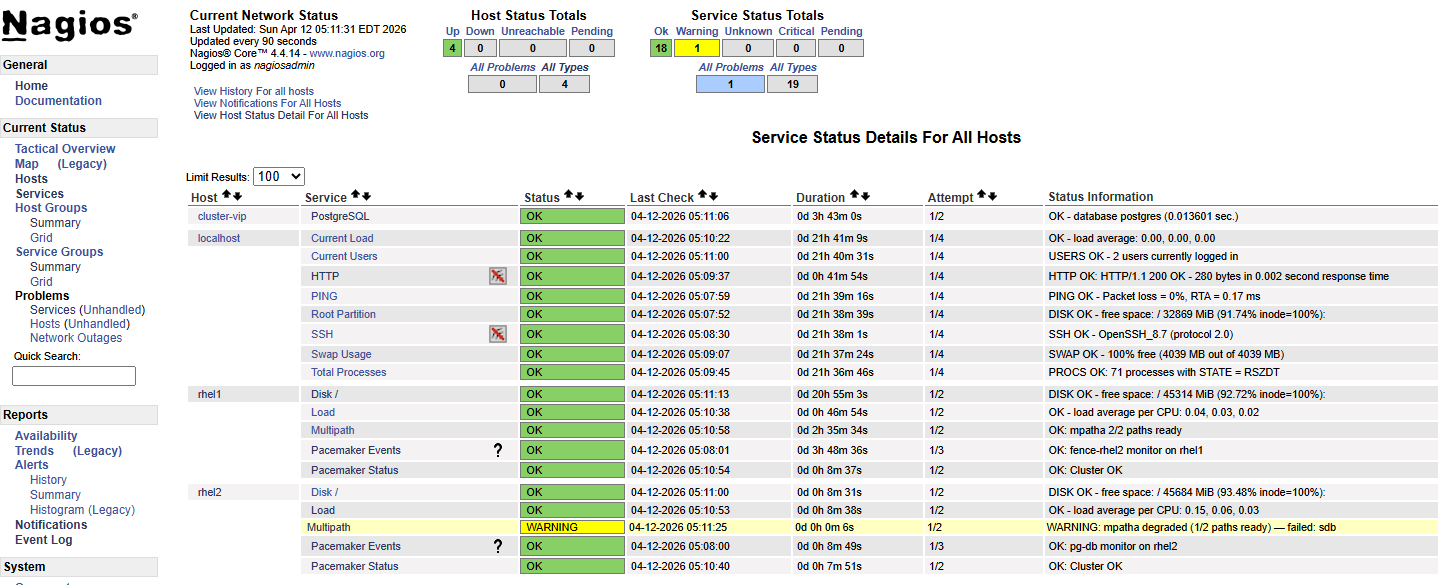
Nagios multipath monitoring during single-path degradation (separate test):
With one cable pulled, the Multipath service on rhel2 went WARNING in Nagios
within the next poll interval:
WARNING: mpatha degraded (1/2 paths ready) — failed: sdb
Write loop showed zero disruption — multipath transparently rerouted all I/O through the remaining path. This is the correct behavior: single-path loss is absorbed silently at the storage layer, surfaced as a warning in monitoring, and requires no cluster-level action. It is a signal that redundancy has degraded and attention is needed before the situation worsens — not a failover trigger.
Screenshots
 —
—
 —
—
 —
—
 —
—
 —
—
Logging
Log Sources
| Source | Location | What it covers |
|---|---|---|
| Pacemaker | /var/log/pacemaker/pacemaker.log |
All cluster decisions, resource transitions, fencing events |
| Corosync | /var/log/cluster/corosync.log |
Node membership, quorum changes |
| systemd | journalctl -u pacemaker |
Useful for startup/shutdown; less detail than pacemaker.log |
| PostgreSQL | /mnt/cluster1/pgsql/data/log/ |
Application-level errors — I/O panics will appear here before Pacemaker acts |
The primary log for cluster troubleshooting is pacemaker.log. It contains timestamped entries from every Pacemaker subsystem — the CIB, the scheduler, the executor, the fencer — and shows the full decision chain during a failover. Corosync’s log is narrower and more useful for isolating membership and split-brain events specifically. The PostgreSQL logs on shared storage are worth knowing about because a storage failure will surface there first, before Pacemaker’s monitor fires.
Useful Commands
# Watch cluster status live
crm_mon -f -r

# Follow pacemaker log in real time
tail -f /var/log/pacemaker/pacemaker.log

# Filter for a specific resource
grep pg-db /var/log/pacemaker/pacemaker.log

# Filter for fencing events specifically
grep -i -e fence -e stonith /var/log/pacemaker/pacemaker.log

# Show recent cluster transitions
grep Transition /var/log/pacemaker/pacemaker.log

# Enable debug logging for a specific subsystem (not persistent)
# Edit /etc/sysconfig/pacemaker:
# PCMK_debug="pacemaker-execd"
# then: systemctl restart pacemaker
Operational Notes
Pacemaker’s log is verbose during normal operation — heartbeats, monitor results, CIB updates all produce entries. The signal-to-noise ratio improves once you know what normal looks like. Spend time reading the log during non-incident periods so that during an actual failure the pattern of a clean failover versus something going wrong is immediately recognizable.
The PCMK_debug variable in /etc/sysconfig/pacemaker enables subsystem-level debug logging. It was used during this build to diagnose the alert agent not firing (enabling pacemaker-execd revealed the invocation details). It requires a Pacemaker restart and is not intended for persistent production use.
Operational Reference
Cluster Status
The go-to command. Run it from either node — both have a consistent view.
[root@rhel1 /]# pcs status
Cluster name: mycluster
Cluster Summary:
  * Stack: corosync (Pacemaker is running)
  * Current DC: rhel1 (version 2.1.10-1.1.el9_7-5693eaeee) - partition with quorum
  * Last updated: Mon Apr 13 07:32:19 2026 on rhel1
  * Last change:  Sun Apr 12 05:07:39 2026 by root via root on rhel1
  * 2 nodes configured
  * 6 resource instances configured

Node List:
  * Online: [ rhel1 rhel2 ]

Full List of Resources:
  * fence-rhel1 (stonith:fence_pve):     Started rhel2
  * fence-rhel2 (stonith:fence_pve):     Started rhel1
  * pg-lvm      (ocf:heartbeat:LVM-activate):    Started rhel1
  * pg-fs       (ocf:heartbeat:Filesystem):      Started rhel1
  * pg-vip      (ocf:heartbeat:IPaddr2):         Started rhel1
  * pg-db       (ocf:heartbeat:pgsql):   Started rhel1

Daemon Status:
  corosync: active/enabled
  pacemaker: active/enabled
  pcsd: active/enabled
Things to look at: all nodes Online, all resources Started, Daemon Status all active/enabled, “partition with quorum” in the summary. Any deviation from this is worth understanding.
crm_mon -1 -r -f gives a similar view with slightly more detail including migration history and fail-counts.
Moving Resources — Standby and Unstandby
Putting a node into standby is the clean way to move resources off it for maintenance. Pacemaker gracefully migrates everything to the other node.
[root@rhel2 ~]# pcs node standby rhel1
Resources migrate within seconds. The standby node stays in the cluster and participates in quorum — it just won’t run resources.
Node List:
  * Node rhel1: standby
  * Online: [ rhel2 ]

Full List of Resources:
  * fence-rhel1 (stonith:fence_pve):     Started rhel2
  * fence-rhel2 (stonith:fence_pve):     Stopped
  * pg-lvm      (ocf:heartbeat:LVM-activate):    Started rhel2
  * pg-fs       (ocf:heartbeat:Filesystem):      Started rhel2
  * pg-vip      (ocf:heartbeat:IPaddr2):         Started rhel2
  * pg-db       (ocf:heartbeat:pgsql):   Started rhel2
Return the node to service:
[root@rhel2 ~]# pcs node unstandby rhel1
Resources do not automatically migrate back — they stay on rhel2 until the next natural failover or manual move. rhel1 resumes its role as a live standby.
Maintenance Mode
Maintenance mode tells Pacemaker to stop managing resources entirely — no monitoring, no restarts, no failovers. Use it when you need to work on something without the cluster fighting you: stabilizing a resource that keeps failing, making configuration changes, or any situation where automated recovery would make things worse.
[root@rhel2 ~]# pcs property set maintenance-mode=true
Status shows the cluster has stepped back:
              *** Resource management is DISABLED ***
  The cluster will not attempt to start, stop or recover services

Full List of Resources:
  * fence-rhel1 (stonith:fence_pve):     Started rhel2 (maintenance)
  * fence-rhel2 (stonith:fence_pve):     Started rhel1 (maintenance)
  * pg-lvm      (ocf:heartbeat:LVM-activate):    Started rhel2 (maintenance)
  * pg-fs       (ocf:heartbeat:Filesystem):      Started rhel2 (maintenance)
  * pg-vip      (ocf:heartbeat:IPaddr2):         Started rhel2 (maintenance)
  * pg-db       (ocf:heartbeat:pgsql):   Started rhel2 (maintenance)
Check that it’s set before assuming:
[root@rhel2 ~]# pcs property config | grep maintenance-mode
  maintenance-mode=true
Return to normal:
[root@rhel2 ~]# pcs property set maintenance-mode=false
Monitors resume immediately. Don’t forget to turn it off.
Clearing Failed Resources
After a resource failure that has been resolved, Pacemaker retains the failure record. The resource may be running again but the cluster still shows a fail-count. Clear it:
pcs resource cleanup pg-db
Or clear all resources at once:
pcs resource cleanup
This resets fail-counts and clears any failed action history. Run pcs status after to confirm everything looks clean.
Key Design Decisions and Rationale
- Brainstorm likely failure scenarios early, then test them aggressively. Pay special attention to partial/gray failures (server off in the weeds, lost backend connectivity, etc.), not just clean “node died” cases.
- Incorporate solid alerting. If failover works, you won’t see customer impact — but you still need to know it happened.
- Favor general, composable mechanisms (even if partly manual) that emphasize survivability and operability under pressure. They don’t need to predict every failure — only supply the building blocks and flexibility to adapt when reality inevitably deviates.
- Keep complexity under control. In HA systems, unnecessary complexity becomes a failure mode of its own.
- “Edge case, we’re working on it” is acceptable — for a while. HA maturity is iterative.
Implementation Footnotes
Known Limitations & Accepted Risk
Fencing topology — Each fence resource targets the hypervisor hosting the VM. If that hypervisor fails, fencing fails and automatic failover stalls. Cross-host fencing via the Proxmox cluster API was tested and did not work. iDRAC was rejected as a fallback due to unacceptable blast radius (fences entire physical host). Accepted limitation.
Explored and Rejected
PostgreSQL functional health check — The pgsql resource agent supports monitor credentials that run an actual query on each interval rather than checking process existence. Implemented and exercised. The functional check proved more sensitive to transitional state than PostgreSQL itself — failing on conditions that were expected and temporary, risking recovery actions against a database that was functioning correctly or about to be. Backed out.
Platform Realities
SELinux — Significant SELinux work was required across both the cluster resource stack and the monitoring layer. Shared storage contexts are covered in section 6.9; monitoring policy modules and booleans in section 8.7. The common thread: RHEL 9 SELinux is aggressive at privilege and domain boundaries, manual invocations as root mask problems that only surface when agents run in confined contexts.
no_path_retry — queue is commonly recommended for standalone servers but is the wrong choice in a cluster — you need I/O to fail so Pacemaker can detect storage loss and act. Red Hat’s own default is fail. Getting fail to actually apply required an overrides section (which beats device-specific stanzas) combined with features "0" to prevent multipathd from silently re-injecting queue_if_no_path into the kernel dm table when a numeric retry count is used. If the storage environment changes, this choice warrants revisiting.